Monitoring Airbyte
Airbyte offers extensive logging capabilities.
Connection logging
All Airbyte instances include extensive logging for each connector. These logs give you detailed reports on each data sync. Learn more about browsing logs.
OpenTelemetry metrics monitoring
Self-Managed Enterprise customers can configure Airbyte to send telemetry data to an OpenTelemetry collector endpoint so you can consume these metrics in your downstream monitoring tool of choice. See OpenTelemetry metrics monitoring. Airbyte Cloud does not currently support a an OTEL integration.
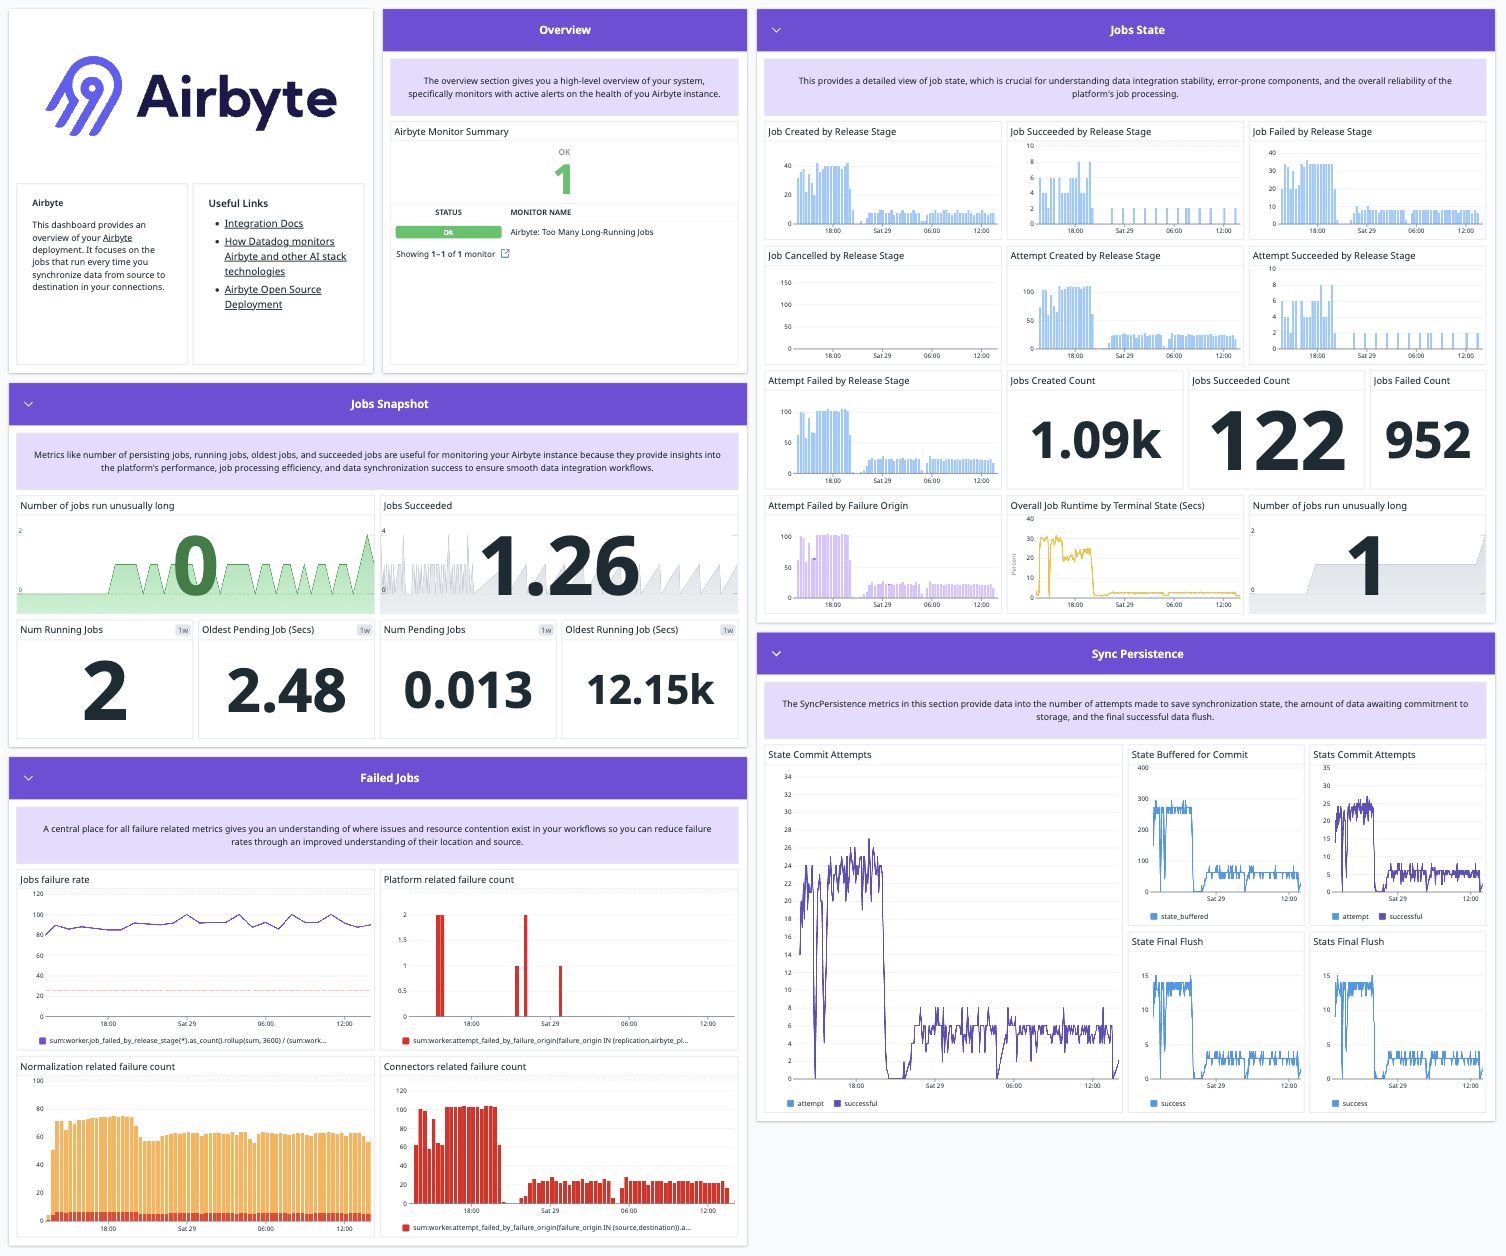
Datadog Integration
Self-Managed Enterprise customers can send metrics to Datadog using OpenTelemetry. Airbyte Cloud does not currently support a Datadog integration.